Since the beginning of the pandemic, we have been producing the Eco-Counter Index four times a year, which analyzes bicycle traffic in 14 countries around the world, in order to gain a better understanding of both utilitarian and recreational use. At we kick off 2023, what should we remember about the trends in bicycle use in 2022?
A visible increase in use between 2019 and 2022, more moderate between 2021 and 2022
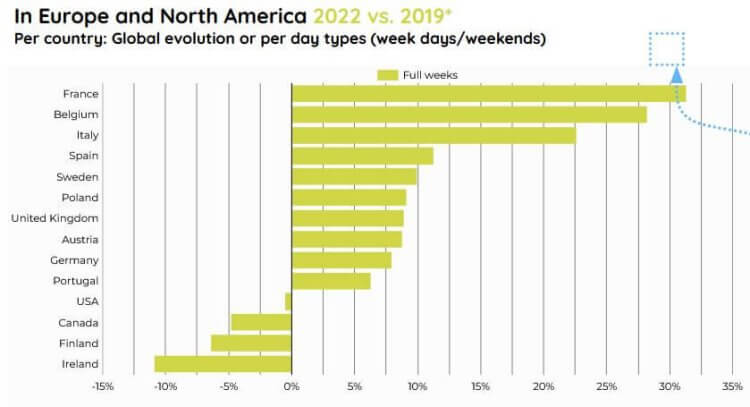
Across all the countries studied, the figures show an 11% increase in total bicycle use, +10% on weekdays and +18% on weekends compared to 2019.
Compared to 2021, bicycle use is up more slightly: 5% overall, +6% weekdays, +4% weekends.
France is the country where cycling has increased the most between 2019 and 2022
Of the 14 countries studied, France has the highest increase in traffic, followed by Belgium and Italy! USA, Canada, Finland and Ireland recorded a decrease in bicycle traffic between 2019 and 2022.

It is interesting to note that the breakdown of traffic between weekdays and weekends shows similar trends. Countries with strong growth in ridership see both weekday and weekend traffic increase. Conversely, countries with declining traffic also have declining traffic on weekends and weekdays (with the exception of Canada, Finland and the UK).

In Canada and USA, a more modest increase
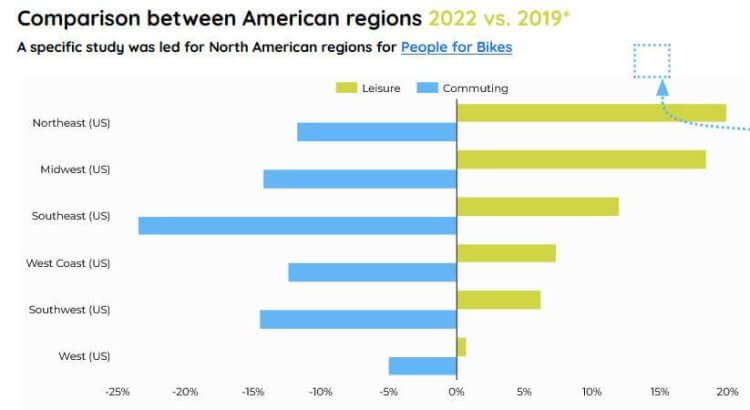
In Canada and USA, cycling is more stable between 2019 and 2022. The evolution of traffic (respectively -5% for Canada and -1% for the USA) can be decomposed in an increase in weekend use and a decrease in weekday traffic. Leisure use seems to be increasing, while utilitarian use has not yet returned to its pre-pandemic level.
In partnership with People for Bikes, we have also produced a specific analysis for USA regions, analyzing global trends as well as leisure and commuting practice. A snippet is available on our webpage, but more detailed results are also visible on PFB website here (under « Ridership trends »).


Il n'y a pas encore de commentaires