Comprendre les flux et les usages pour transformer vos territoires.
Nous fournissons des indicateurs fiables et des leviers actionnables basés sur l’analyse des données de fréquentations piétonnes et cyclistes.
Prenez des décisions éclairées pour apaiser les villes, promouvoir les mobilités durables et préserver les espaces naturels.
compteurs
pays
clients
Une expertise globale de comptage et d’analyse de données
Découvrez comment notre expertise, notre philosophie, nos méthodes et nos innovations peuvent vous aider à développer les mobilités durables, mesurer l’attractivité touristique et préserver les sites naturels de vos territoires.

Un contact humain
Un accompagnement à chaque étape :
- Conseil en amont de votre projet
- Aide à la prise de décision
- Accompagnement à l'analyse des données
- Support et installation de nos solutions
- Un contact local partout dans le monde
Des outils performants
Construire des indicateurs fiables :
- Application d'analyse de données de comptage
- Page web dédiée de partage de données
- API, pour retrouver vos données sur vos outils
- Visualiser : météo, vitesse, direction...
- Les bons indicateurs pour faire les bons choix


Une technologie à la pointe
La technologie au service de vos besoins :
- La puissance de l'intelligence artificielle
- Fusion de données de comptage
- Croisement de données quanti et quali
- Prédiction de flux
- L'innovation au cœur de notre ADN
Nos clients témoignent
"Les données de fréquentation nous sont très utiles à la fois pour voir, suivre et analyser, mais également pour communiquer avec le grand public, et corriger si nécessaire les ...aménagements cyclables que nous réalisons dans le cadre de notre Plan Vélo."
"Une phase de test a été menée par Eco-Compteur avec la solution VisitorFlow. Cette dernière nous a permis, sur une période d'un mois, de comprendre les usages et comportements ...des touristes et visiteurs, notamment : temps de visite sur place, origine géographique, variation de la fréquentation en fonction des évènements sportifs et/ou des conditions météorologiques, y compris la houle, puisqu’on est spot de surf ! L’essai a été concluant, et nous avons décidé de lancer une campagne sur une durée de plusieurs mois pour obtenir des données suivant les saisons et évènements"
"Les données de fréquentation et leur partage en temps réel grâce à la Page Publique marquent la volonté de l’EuroMétropole d’agir en parfaite transparence avec le public, afin ...que les données de fréquentation puissent servir aux usagers et associations soucieuses des enjeux de mobilité dans l’espace public."

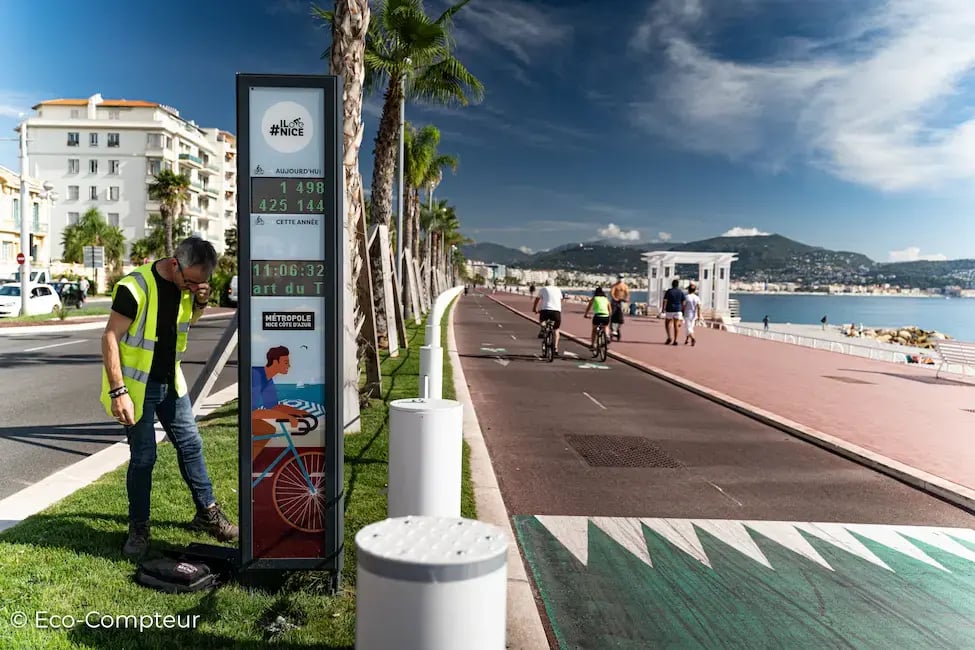
Depuis quelques années, la Métropole de Nice s’est équipée de compteurs automatiques pour mesurer la fréquentation vélo, ainsi que d’afficheurs « Eco-DISPLAY Classic » qui lui permettent de communiquer avec le grand public. Les données de fréquentation ont permis à Nice Côte d’Azur Métropole d’analyser son réseau cyclable, et d’aménager des pistes cyclables en connaissance de cause.
Voir le cas client
La commune de Plomeur et la communauté de communes du Pays Bigouden sud (Finistère) utilisent VisitorFlow pour observer la fréquentation du site de la pointe de la Torche, et mesurer l’impact des événements sportifs européens comme la compétition de surf du circuit Pro Junior de la WSL (World Surf League).
Voir le cas client
