In the past few weeks, governments around the world have taken drastic actions to slow the spread of COVID-19. During this time, count data has taken on a whole new application: capturing the impact of a pandemic on how people move and measuring the effectiveness of confinement measures.
Interested in understanding how count data can help you understand the impact of confinement efforts?
Discover our specific COVID-19 tools and analyses, below
Using count data to understand the pandemic and review confinement measures
Weekly produce markets: ban them, or keep them?
In France, the issue of daily and weekly markets has given rise to some controversy. To many people, these markets are essential services. They are, however, places in which close physical proximity to others is hard to avoid.

With the help of data, it is possible to understand pedestrian trends at specific events, such as daily and weekly markets. Count data gives an understanding of overall footfall, providing decision makers with a quantitative tool on which to base policies surrounding market openings and closures.
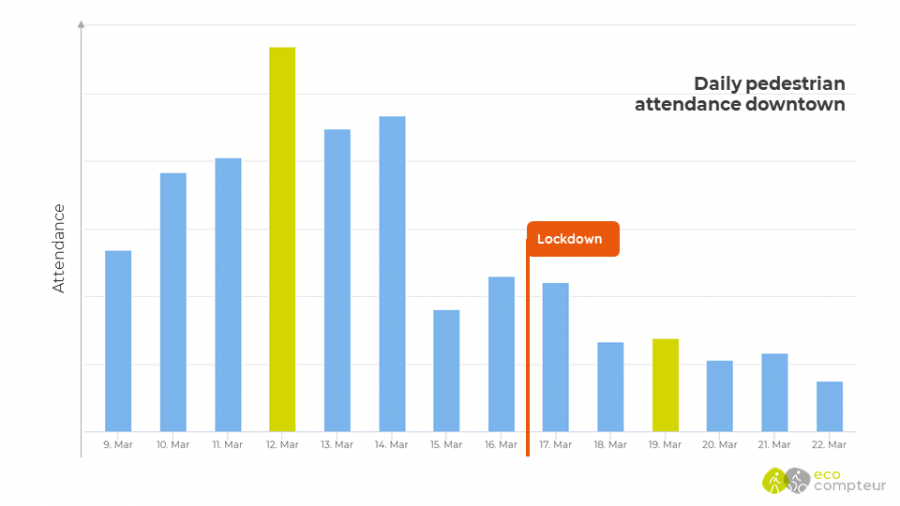
The data above, for example, shows the pedestrian count trends in a French city center over the past few weeks. In this particular case, the market day is Thursday, in green. We see that the number of people attending the Thursday market decreased dramatically after confinement measures were enacted, and counts on the market day are broadly in line with the average daily counts for non-market days.
Walking and hiking trails
In France, regional orders prohibited access to beaches and trails on the 17th of March. Count data from nearby trail counters has enabled local authorities to assess the extent to which the ban has been respected.
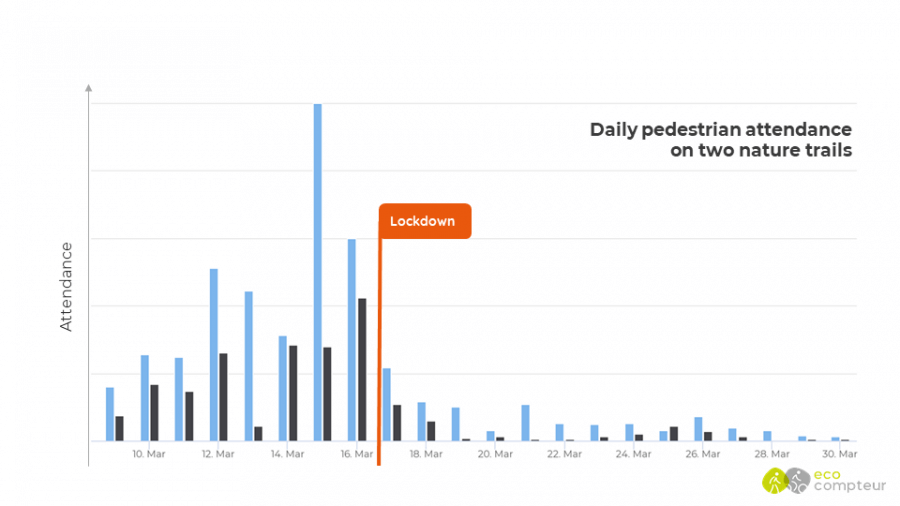
As the figure above (an analysis of two trail counters) shows, while the ban was generally respected, some paths still recorded abnormal (or, above 0) counts. While counts remain low, they were also slightly higher on weekends.
Respecting curfews
In some cities across France, curfews were enacted to ban people from leaving their home at night. Closely looking at data – down to the hourly level – shows to what extent this has been respected and can highlight areas that may need to be checked as a priority.
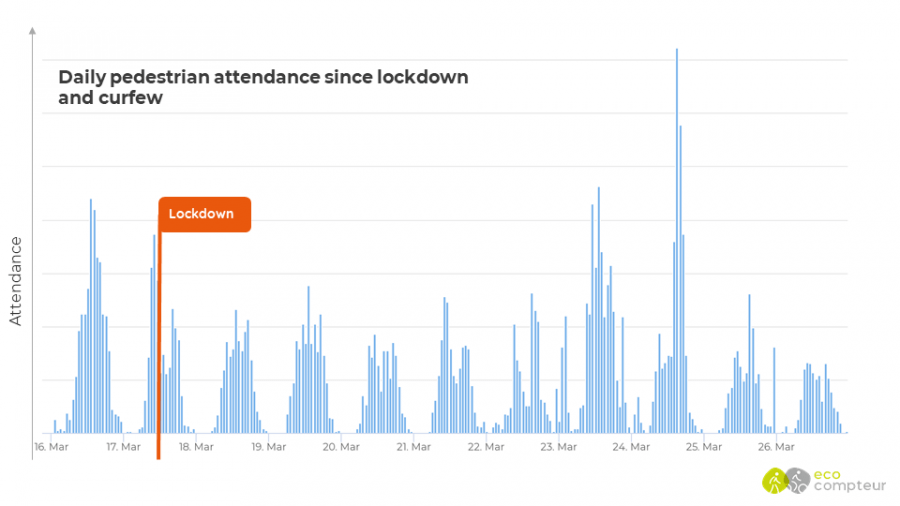
The example French city above shows two things. The first is that since confinement, pedestrian counts have been reduced by around 50%. Secondly, during the nightly curfew hours, we see zero or non-zero counts, suggesting that the measures are being widely respected.

The impact of weather on recreation during confinement
Weather data, superimposed on the count data, also allows you to quantify the effect of good weather on compliance with containment.
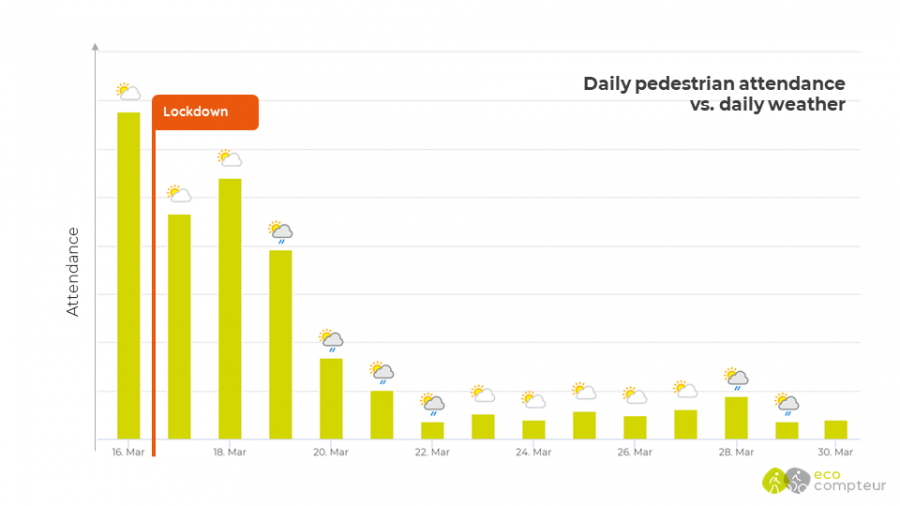
In the example above, we can see here that, despite good weather during the second week of confinement – when we would traditionally expect counts to spike – the number of counts remain low.
Urban and suburban parks
In this era of confinement, urban and suburban parks have becoming an interesting focal point for policy makers. On the one hand, many places with confinement have allowed (and, in some cases encouraged) their citizens to exercise out of the house. However, crowding in parks as people enjoy spring days can cause problems for social distancing and transmission, raising questions about the best restrictions for parks during confinement.
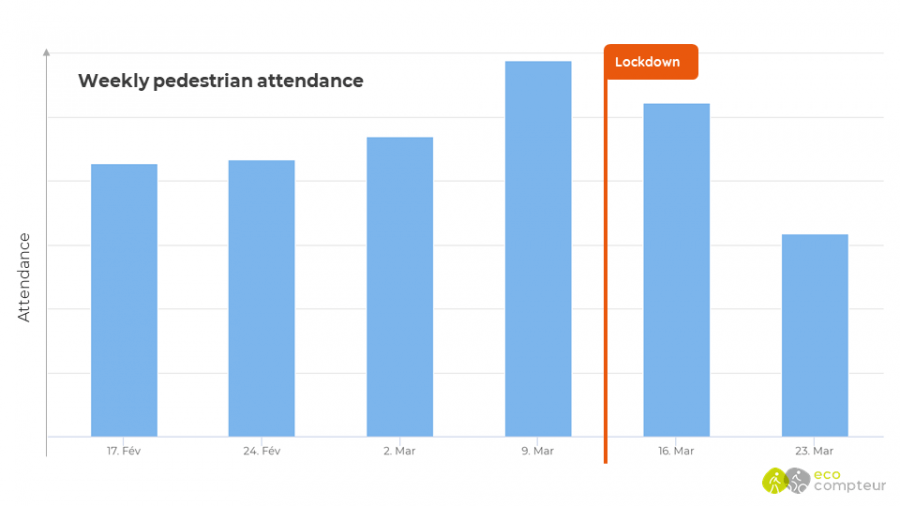
The figure above, for example, draws on weekly pedestrian count data from a suburban park in France. In the week leading up to confinement, counts increased, likely thanks to the improving spring weather. After confinement measures were enacted, counts rapidly dropped off as people became confined to their house, leaving only for occasional exercise.
How we can help you
 We are pleased to share with you COVID-19 specific dashboards in Eco-Visio 5. These dashboards allow you to carry our simple analyses on your domains, providing you an overview of how bike and pedestrian counts are trending with the pandemic and confinement measures.
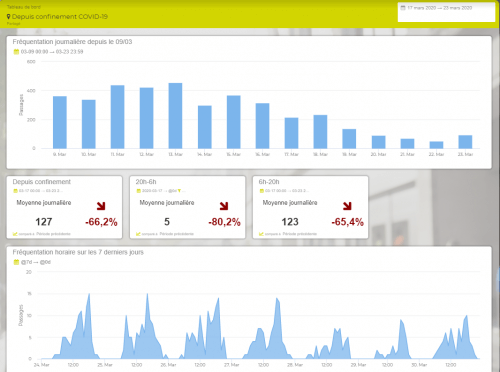
 Do you already have counters and are interesting in further studying the impact of the COVID-19 pandemic on count data? Our data service team is here to help.
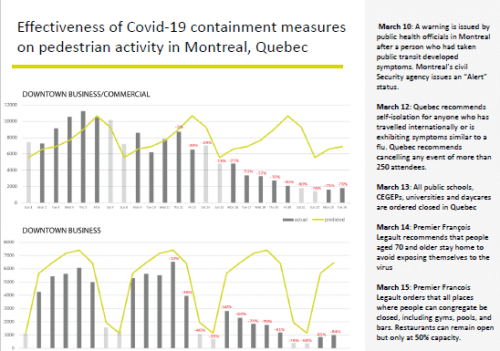
Download our case study on the pandemic’s impact on pedestrian counts in Montreal
 Looking to learn more about turnkey solutions for counting bikes and pedestrians? Our temporary people counters, such as the PYRO-Box, are easy quick to install and move around – the perfect tool for short-term counting.




Il n'y a pas encore de commentaires