The following is an altered version of an original post by Amelia Neptune and our friends at the League!
How can data tell the story of cycling in your community? Together with the League of American Bicyclists, we hosted the third-annual ‘Bikes Count’ Data Competition to explore this question with communities across the U.S.
We’re excited to share this year’s competition winner: the University of New Orleans Transportation Institute (UNO)! Their application showcased an impressive collaborative effort among research partners, the city government’s Moving New Orleans Bikes initiative, and advocacy organization Bike Easy to collect and understand data in New Orleans.
Our recent webinar, “Bikes Count in the Big Easy: A snapshot of Cycling in New Orleans” dove into the data challenges faced by UNO and their collaborators. The webinar emphasizes the importance of data in planning and the various ways it can be used, from short-term insights to long-term projections, economic impact analysis, and data fusion with other sources.
Watch the webinar recording below to find out what to do with data once it’s collected and how to utilize it for storytelling, advocacy, and understanding bicycling in a community!
Congratulations to the University of New Orleans for winning this year’s data competition! The results are incredibly helpful both for local application in New Orleans as well as on a wider scale in helping highlight the importance of partnerships when collecting, utilizing, and storytelling with data. Thanks again to the League for their continued collaboration to make this competition a success!
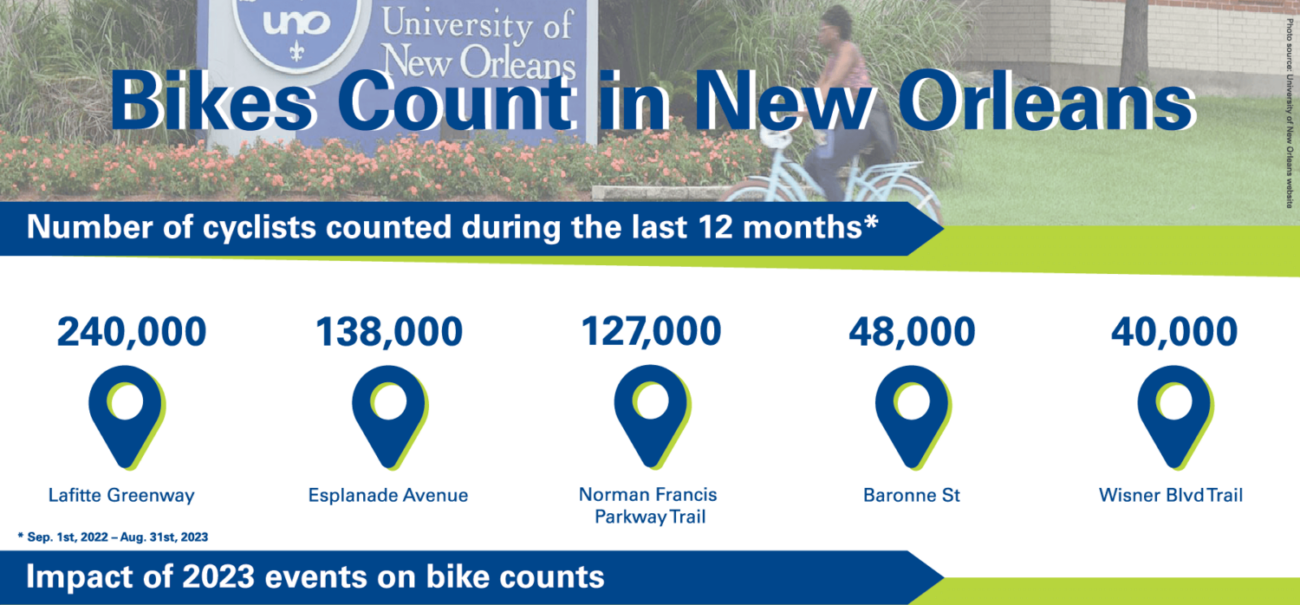
On our side, we were able to create an infographic for UNO on their bike count data:

Download the full infographic here.
If you want to know more about the competition, read about our past winners here. As well, you can view the League’s past webinars on data collection and analysis best practices, and check out Bike Easy’s dashboard for additional inspiration for what it looks like to make data accessible for the public. You can also look for funding opportunities to support your communities’ bike count and data collection efforts on FHWA’s Funding table.


Il n'y a pas encore de commentaires