Since the beginning of the pandemic, we have been producing the Eco-Counter Index four times a year, which analyzes bicycle traffic in 14 countries around the world, to better understand both commuting and recreational bicycle use.
The update has been made recently for the first quarter, and here is what to remember about the trends in cycling in the first quarter of 2023!
An increase in weekday bicycle traffic between 2022 and 2023, and a slight decrease on weekends
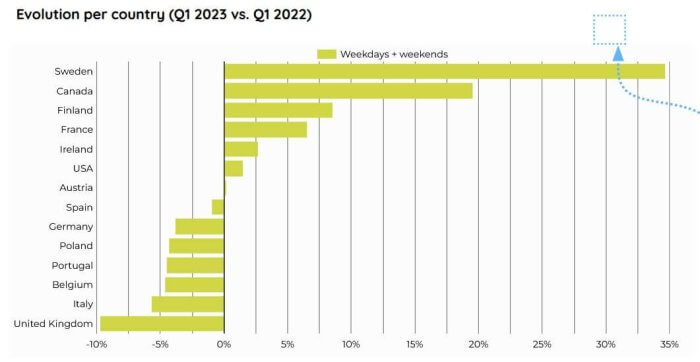
For all the countries studied, the figures show a total increase of 3% in bicycle use between the first quarter of 2023 and the first quarter of 2022. This overall increase of 3% is broken down into a 6% increase on weekdays and a 2% decrease on weekends (still compared to the same period in 2022).

A notable increase in practice in Canada & Sweden compared to 2022
Out of the 14 countries studied, Sweden recorded the largest increase in traffic, followed by Canada and Finland! Approximately half of the countries studied recorded an increase in traffic vs. 2022. USA is recording an increase of 2% and the UK traffic is down by 10%.

As the top 3 is trusted by countries with (sometimes) harsh winters, the question is: are we seeing a weather effect in those trends? First of all, it is important to note that the first quarter of data (winter season) in Nordic countries represents a small proportion of full-year counts (typically between 5% and 10% of total counts throughout the year). This means that the variation from year-to-year during this period can be high, but is not necessarily representative of the full-year trend.
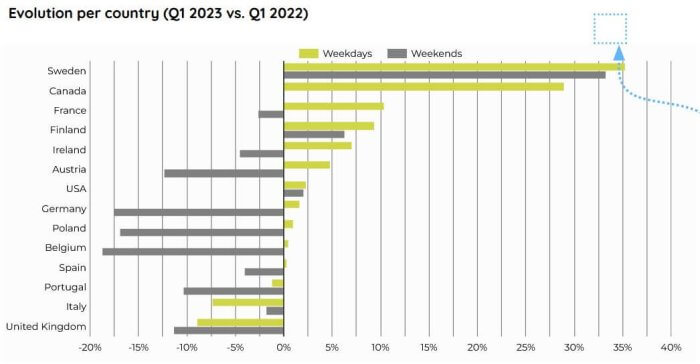
However, if we analyze the changes in attendance between weekdays and weekends, we can see the following trends:
- The increase is strong both during the week and on weekends in Sweden, which could support the weather hypothesis
- However, in Canada, the increase is notable during the week, but traffic remains stable on weekends, which could rather indicate an increase in bicycle commuting in the first quarter of 2023 (and a weather effect that could be less prominent).
- The same trend can be observed in France, where traffic increases strongly on weekdays, but decreases slightly on weekends.

Evolution of bicycle traffic for American regions
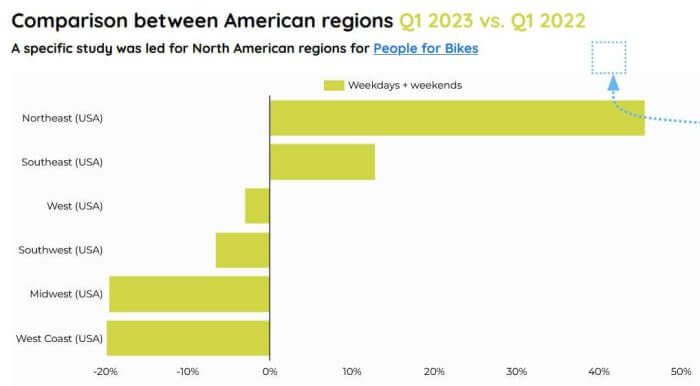
A specific study is done each quarter for North American regions for People for Bikes. The recent update shows an increase of bicycle traffic in the Northeast and Southeast regions, and a decrease in the rest of the regions.

Bicycle traffic history for the entire panel and examples
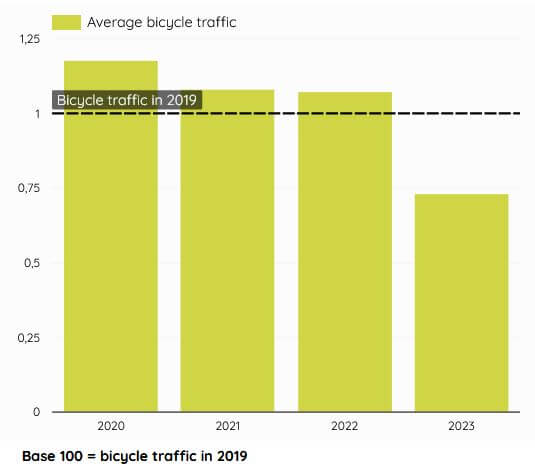
A new indicator has been added to this dashboard! It gives access to the history of bicycle traffic since 2019, using the 2019 bicycle traffic as a reference point. It allows you to see, year after year, how traffic evolves globally, and each country. At the global level (panel of 14 countries), the trend is as follows:

After a sharp increase in traffic in 2020, linked to the health context (need for physical exercise, outdoor activities), bicycle traffic decreased slightly in the following years but nevertheless remained at a higher level than 2019.
The 2023 trend is still too partial to judge bicycle ridership over the year (the winter period is traditionally less frequented, resulting in lower average bicycle traffic).
—
About our data analysis services
Do you have any comments or suggestions? Would you like to use the data? Conduct a customized study for your needs? As with this global study, we can conduct custom studies to meet your needs, contact us!


2commentaires
Hi Charlie, thank you for your feedback! We hear you, and we’d love to help you promote cycling in your local city. We have clarified the references to bicycle traffic already, but are there any additional changes we could make to our article or graphs that would make it easier for you to share with your city council? If so, leave us a comment or shoot us an email at [email protected] and we’ll be in touch!
Your use of the shortened version of bike traffic to just “traffic” is a poor. The first time I read this, I had to do a double read to understand what was really meant.
I had wanted to pass this along to my local city council to promote cycling, however maybe not.