Why is the Weatherford Mountain Bike Club unique?
Over the past years, two words can describe WMBC: exponential growth.
No stranger to experience, the Weatherford Mountain Bike Club was started over a decade ago. Back then, they had no trails to speak of- but they did have a dedicated and motivated team. Fast forward to today, they manage 5 trail networks spanning over 25 miles and 322 acres of land.

Volunteers from the Weatherford Mountain Bike Club working on the Quanah Hill trail. They built this 7+ mile trail entirely by hand. (Credit: Weatherford Mountain Bike Club)
What sets WMBC apart is their community-centric, collaborative approach to trail development and their focus on data to optimize trail management. These values are what brought them to eventually work with IMBA and Eco-Counter on a temporary trail count study.
The Role of Trail Counts in WMBC’s Strategy
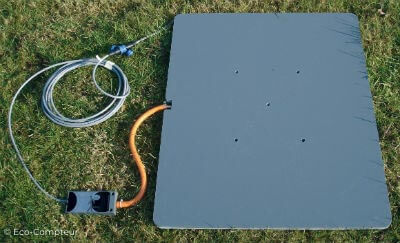
In early 2024, the Weatherford Mountain Bike Club won a contest held by Eco-Counter and IMBA, receiving a PYRO-Box Evo counter for a temporary trail count study. Their pitch was to count visitors on their popular Quanah Hill trail, a 100-acre property with a 7-mile trail for both pedestrians and mountain bikers.
Why Trail Counts Mattered to them
Trail counts had been top of mind for WMBC for a while now. The main reason being that Texas is home to 6 of the 10 fastest growing counties in the U.S. As more people flocked to their trails, WMBC would need reliable data on how many people were visiting their trails and when. From there, they could improve management and justify the need for greater investment in their trails to relevant parties.
In the past, WMBC tried counting visitors with a car counter. However, the challenge was that there was a lot of guesswork involved, with no real way of knowing how many people were in each car. (Spoiler alert: when they started trail counting with their PYRO-Box Evo, they had more visitors than they thought.)
How they set up their Trail Count Program
A trail count program relies on strategically placed sensors throughout key points on an organization’s trail system. These sensors collect anonymous data about the number of visitors who pass through specific sections of the trail. This data is then aggregated and analyzed to determine peak usage times and high-traffic areas.
Though they only had one counter, it was obvious to WMBC where they should place it for maximum returns. Smartly, they installed it on the trailhead of Quanah Hill, where visitors walked past to get in or out of the trail. This was the main entrance, and they estimated that it would capture at least 95% of people who visit the park.

A map of the Quanah Hill trail. (Credit: Weatherford Mountain Bike Club)
For their study, they counted visitors from the beginning of December 2023 to the end of March 2024.

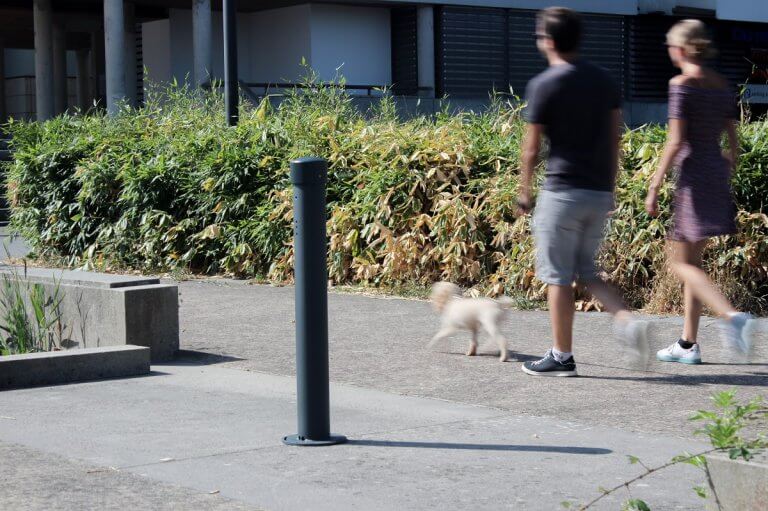
The PYRO-Box Evo counter at the Quanah Hill trailhead. (Credit: Weatherford Mountain Bike Club)
The Results of WMBC’s Trail Count Program
Now, to answer the burning question.
With only four months of data and a single trail counter, what did WMBC learn? You might not think much would be revealed, but the findings were a big surprise to WMBC.
In summary, the results of the study highlight the difference between guessing and knowing.
First and foremost, WMBC learned that Quanah Hill averaged about 100 counts per day during the four-month period (and because of where they installed the counter, this likely represented around 100 people). This quantifiable knowledge was a big improvement from car counter estimates or general observations that the trail was busy.
Of course, there was heavy variation as well, which the counter revealed. On the slowest days — when the trail was closed due to weather — Quanah Hill got 0-10 counts. On this busiest day, they got 261 counts. This day was Presidents’ Day, which was not their first guess for the busiest holiday on their trail. But, now that they knew, they could anticipate the holiday’s rush next year.

Lush greenery on Quanah Hill. (Credit: Weatherford Mountain Bike Club)
Adding on, one logical assumption WMBC made was that people wouldn’t want to visit in freezing cold weather. However, their counts told a different story. When the temperature fell below freezing, they still got at least double-digit counts — with the highest of these days seeing 159 counts. This was important to know so that they could prepare maintenance and resources even on cold days.
Finally, a key finding: what days and times Quanah Hil was the busiest. WMBC made initial guesses for these but were proven wrong by the counter. First, they thought that Saturday would be their busiest day of the week by far. But, as it turns out, their busiest day was Sunday. They also thought that Monday would be the least visited day. Surprisingly, their least visited day on average was Friday.
Looking at busiest times, WMBC thought that Saturdays around noon would have the most people entering. Turns out, they had the most people coming in on Saturdays around 4pm. They were also surprised by Sundays around 4pm being the second most popular time, with Tuesdays at 6pm coming in third. As a last observation, they were intrigued by the fact that visitors tapered off sharply at around 7pm every day.
Conclusion
Trail counts provide valuable insights into how often the trails are used, at what times, and in what conditions. By collecting this data, even for a period as short as four months, WMBC was able to see how busy their trails were, when they were busy, and how they should plan their maintenance going forward.
Their final goal was to combine the findings into a report to present to the City of Weatherford to justify the need for further investment— which they successfully completed.
Overall, the Weatherford Mountain Bike Club is a model for how local organizations can use data to enhance their outdoor recreational spaces. Their trail count study represents a forward-thinking approach to sustainable trail management for the benefit of communities in Northern Texas.

Quanah Hill at sunset. (Credit: City of Weatherford)
You can learn more about WMBC on their website.


